Here's the catch: radio has never made proving that trust easy. Unlike a paid search account where conversions tick up by the hour, radio has historically run on lagging indicators — ratings reports, gut instinct, and hope. Many advertisers fund a flight, wait a few weeks, see no obvious spike, and pull the plug. Was the campaign actually failing? Or did nobody set up the tracking to know?
This guide covers the KPIs that matter, four measurement methods you can combine, how to read results without jumping to conclusions, and the mistakes that quietly sabotage good radio campaigns. By the end, you'll know how to prove — or fix — your radio ROI in 2026.
Key Takeaways
- Track five core KPIs — reach, frequency, GRPs, CPP, and CPM — before layering on ROI analysis
- Track five core KPIs: reach, frequency, GRPs, CPP, and CPM, then add ROI analysis
- No single metric proves radio works: combine brand lift, attribution, and incrementality testing
- Short campaigns and single-channel attribution cause brands to write off radio too soon
- Your interpretation of results decides whether you scale, tweak, or kill a campaign
- Long, structured test windows matter as much as the metrics themselves
Essential KPIs and Metrics for Measuring Radio Advertising
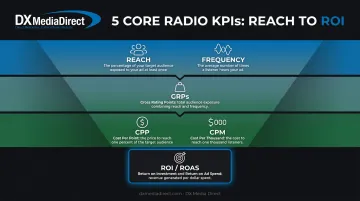
Before picking a measurement method, get the baseline metrics straight. These five KPIs, defined by the Radio Advertising Bureau and Nielsen, describe how efficiently your schedule delivered impressions. They won't tell you revenue impact on their own, but skip them and every method downstream is built on guesswork.
- Reach is the number of unique people exposed to your ad within a given period. It matters most for awareness campaigns: you can't build a brand with people who never hear you.
- Frequency measures how often the average listener hears your spot, and recall climbs with it.
- Gross Rating Points (GRPs) show cumulative campaign weight: GRPs = average quarter-hour rating × number of spots.
- Cost Per Point (CPP) and Cost Per Thousand (CPM) measure buying efficiency, not results.
- ROI/ROAS ties spend to profit: revenue attributable to radio ÷ total radio spend.
Frequency and reach move together as schedule weight increases. A 2020 RAB, Cumulus Media, and Westwood One study of nearly 183,000 commercials found:
| Schedule Weight | Spots/Week | Reach | Frequency |
|---|---|---|---|
| Light | 25 | 50% | 2.0x |
| Medium | 49 | 66% | 3.0x |
| Heavy | 83 | 78% | 4.3x |
Once you know how many people your schedule reaches and how often, the next question is what that reach costs. Use CPP when comparing schedules within the same market and demo. Use CPM when comparing radio against other media in your mix. Neither answers whether the campaign made money — that's where ROI/ROAS comes in, and it's the one KPI on this list that actually closes the loop between spend and profit.
Methods to Measure Radio Advertising Effectiveness
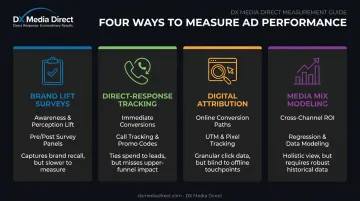
The right method depends on your goal. Brand campaigns need different proof than direct-response campaigns need. Most advertisers get the clearest picture by combining two or three of the following approaches rather than betting everything on one.
Method 1: Brand Lift and Awareness Surveys
This survey-based method measures shifts in awareness, perception, or purchase intent among people exposed to your radio spots versus those who weren't.
Tools needed: pre/post campaign surveys, panel research, brand tracking software.
- Field a baseline survey before the campaign launches
- Run the radio campaign for a defined flight period
- Field a post-campaign survey to the same audience segment and compare shifts in awareness or consideration scores
Pros and cons: Best for measuring long-term brand impact. Limited for proving an immediate sales lift.
Method 2: Direct-Response Tracking
This method attributes specific conversions, such as calls, orders, and sign-ups, directly to a radio spot using unique identifiers like promo codes, vanity URLs, or dedicated call-tracking numbers.
- Assign a unique code, URL, or phone number exclusively to the radio campaign
- Run ads across selected stations and dayparts, logging redemptions or calls in real time
- Compare conversion volume against media spend to calculate a direct cost-per-acquisition
Pros and cons: Delivers hard, attributable numbers ideal for direct-response advertisers, but it demands disciplined creative and consistent offers to work. Agencies such as DX Media Direct build this trackable, revenue-tied structure into every direct-response radio and TV test before a client scales spend.
Method 3: Digital Attribution and Web/Search Lift Analysis
Radio's "point of purchase" often happens on a phone, not on air. This method tracks spikes in website traffic, branded search volume, or app downloads that correlate with your radio flight schedule.
- Establish baseline website and search traffic before the campaign
- Overlay radio air-time logs with real-time traffic and search data
- Identify statistically significant lifts within a defined attribution window after each spot airs
An RAB study analyzing more than 2,100 local radio ads across six categories found search activity averaged 29% above the organic baseline immediately after radio exposure.
Pros and cons: captures radio's digital ripple effect well, but results can be muddied by overlapping campaigns running on other channels at the same time.
Method 4: Media Mix Modeling and Incrementality
This is statistical modeling or a controlled test-market flight that isolates radio's incremental contribution to sales versus every other channel in the mix.
- Select a test market and a comparable control market with similar sales trends
- Run the radio campaign only in the test market for a fixed period
- Compare incremental sales lift in the test market against the control market
Pros and cons: most rigorous method for proving causation instead of correlation, but it demands sufficient budget, time, and disciplined test design. That's why structured 90-day test flights, like the ones DX Media Direct runs for clients before scaling budget, work as a proven alternative to inconclusive programmatic data.
How to Interpret Your Radio Campaign Results
Misreading the data risks two costly errors: killing a profitable campaign too early, or continuing to fund one that's quietly losing money. Here's how to read the signals correctly.
| Signal Pattern | What It Looks Like | Next Step |
|---|---|---|
| Strong performance | High aided-awareness lift, low cost-per-acquisition relative to lifetime value, consistent web/search spikes tied to air time | Scale spend, expand dayparts and stations |
| Mixed/moderate | Adequate reach and frequency, but weak recall or shallow conversion lift | Refresh creative and messaging before cutting spend |
| Underperforming | No measurable lift across brand, web, or sales metrics despite adequate frequency | Reassess the media mix — stations, dayparts, format |
The mixed-signal scenario trips up more advertisers than the other two combined. Reach and frequency numbers look fine on paper, but conversions never materialize. The cause is usually a weak creative or offer, not a placement problem. A spot that doesn't state a clear reason to act, right now, will underperform regardless of how many GRPs you buy.
Full underperformance across every metric requires a different diagnosis than mixed signals do. When reach and frequency are solid but nothing moves across the board, the issue often sits in the media mix itself:
- Brand awareness and aided recall stay flat
- Web traffic and search volume show no spike during air time
- Leads, calls, and sales don't budge despite the campaign
At DX Media Direct, decades of campaign data let our buyers usually pinpoint within weeks whether the culprit is wrong stations, dayparts, or creative that isn't landing.
Common Mistakes That Skew Radio Ad Measurement
Even well-funded campaigns get misjudged when measurement discipline slips. Watch for these three traps.
- Relying on a single metric or method. Judging success by GRPs (Gross Rating Points) alone, without attribution data, shows delivery, not profit. Triangulate multiple measurement types instead.
- Ending a test too early. Cutting a flight short before frequency builds makes radio look ineffective. Recall and response both compound over time.
- Applying standard media mix modeling to a small radio budget without adjustment. Weak spend signals get overwhelmed by natural sales variance, creating "performance bounce," a distortion that undervalues lower-spend channels versus bigger-ticket media.
Each of these mistakes shares a root cause: treating radio measurement like a one-shot verdict instead of a layered process that needs time and multiple data points to resolve.
Best Practices for Measuring Radio ROI in 2026
Getting an honest read on radio performance comes down to process, not luck.
- Combine at least two measurement methods. Pair direct-response tracking with brand lift or digital attribution to triangulate a complete, defensible view of performance rather than relying on one data point.
- Commit to a structured, sufficiently long test window before scaling or cancelling. 90-day test flights are standard practice, giving frequency time to work and producing a scalable playbook instead of the inconclusive data from a 30-day cutoff.
- Work with media buyers who have deep pattern recognition across dayparts, networks, and categories. That experience often separates a fixable media mix from a genuinely weak campaign. A free consultation with DX Media Direct can help diagnose which one applies to your campaign.
Frequently Asked Questions
How do you measure the effectiveness of radio advertising?
Effectiveness is measured through a combination of KPIs (reach, frequency, GRPs) and methods like brand lift surveys, direct-response tracking, digital attribution, and incrementality testing. Combining these methods gives a clearer picture than any single metric alone.
Is radio advertising still effective?
Yes. Radio maintains strong weekly reach and consistently ranks as one of the most trusted media formats, and it increasingly amplifies search and social activity rather than competing against it.
Is radio listenership declining?
No. AM/FM radio still reaches roughly 87% of US adults weekly and continues to dominate ad-supported audio time compared to streaming and podcasts.
How much does a 30-second radio ad cost per month?
Costs vary widely based on market size, station reach, and daypart, typically calculated through cost-per-point rather than a flat monthly rate. Get a custom quote for accurate estimates in your specific market.
What is a good GRP level for a radio campaign?
"Good" depends on your goal and market size. Advertisers typically benchmark weekly GRPs against category norms and schedule weight (light, medium, or heavy) to judge whether they've bought enough weight to influence purchase behavior.
How long should you test a radio campaign before judging results?
Give it a minimum of 90 days. That's long enough for frequency to build and for you to draw statistically reliable, scalable conclusions instead of premature judgments based on early, incomplete data.